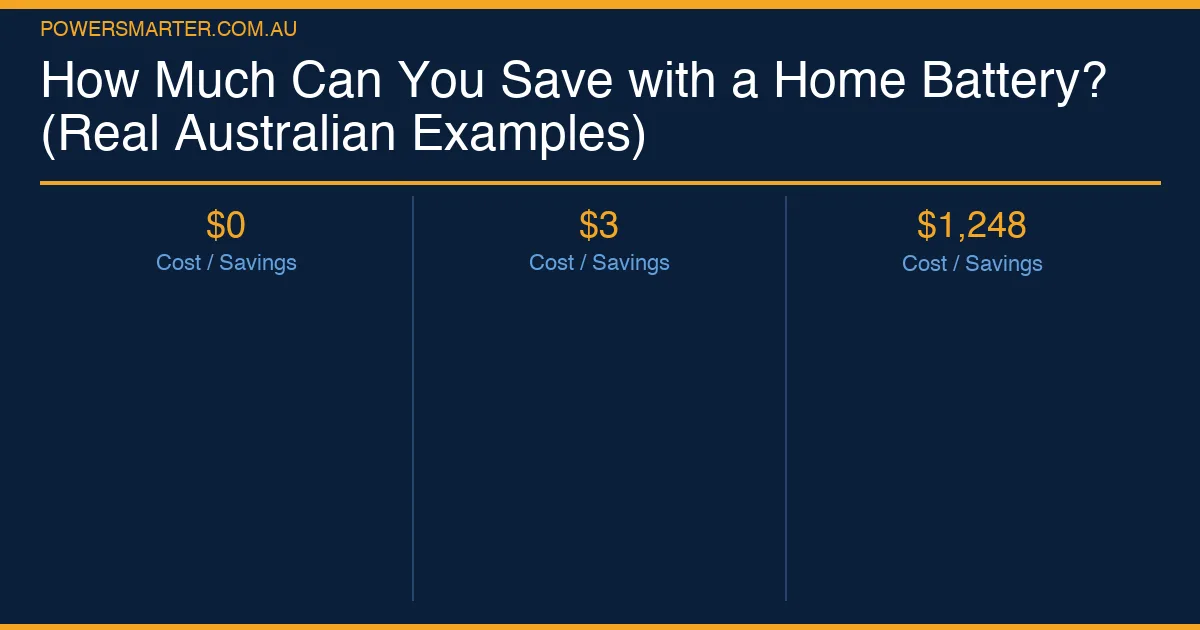
How Much Can You Save with a Home Battery? (Real Australian Examples)

The marketing answer is "thousands per year." The honest answer is "it depends" — but it depends on specific, knowable things. Here are real Australian household examples with the actual savings calculations.
The Key Variables
Your savings depend on:
- How much electricity you use in the evening (the battery's opportunity)
- What you pay for grid electricity (flat rate or TOU peak rate)
- What you get paid to export solar (your FiT)
- How well the battery fills from your solar each day
All four are knowable from your existing bills and solar data. Let's look at real household types.
Example 1: SA Household, High FiT Spread
Profile: 3-person household, Adelaide. 6.6 kW solar. 12 kWh average daily export. 9 kWh average overnight consumption. 10 kWh battery (Sungrow SBR).
Current FiT: 4 cents/kWh
Grid rate: 42 cents/kWh (flat SA rate)
Daily solar stored in battery: 9 kWh (battery fills most days)
Calculation:
- Without battery: 9 kWh exported at 4c = $0.36 earned. 9 kWh imported from grid at 42c = $3.78 spent. Net: −$3.42/day
- With battery: 9 kWh stored and used. 0 kWh imported from grid at peak. Net: $0/day
- Daily saving: $3.42
- Annual saving: $1,248
Post-CHBP net battery cost: ~$6,000 (Sungrow SBR 9.6 kWh, with VIC-style state rebate equivalent; SA doesn't have one but used for illustration). Payback: ~4.8 years. This is a very strong case.
Example 2: Sydney Family, TOU Plan
Profile: 4-person family, Western Sydney. 6.6 kW solar. 8 kWh average daily export. 12 kWh average overnight consumption. Powerwall 3 (13.5 kWh). TOU plan.
Current FiT: 6 cents/kWh
Peak rate (3pm–9pm): 46 cents/kWh
Shoulder rate (rest of daytime): 24 cents/kWh
Off-peak rate (11pm–7am): 16 cents/kWh
Battery operation:
- Charges from 8 kWh of surplus solar during the day
- Discharges 7 kWh into the peak period (5 kWh from solar export that would have happened at 6c, avoided 7 kWh at 46c)
- Battery continues discharging into shoulder/off-peak: remaining 4 kWh at 24c avoided
Calculation:
- Peak displacement value: 7 kWh × (46c − 6c FiT) = 7 × 40c = $2.80
- Shoulder/off-peak displacement: 4 kWh × (20c average − 6c FiT) = 4 × 14c = $0.56
- Total daily saving: $3.36
- Annual saving: $1,226
Post-CHBP Powerwall 3 net cost: ~$9,500–$12,000. Payback: 7.8–9.8 years. Reasonable, though not as strong as the SA example above due to lower peak rate spread.
Example 3: Melbourne Household, VIC Solar Homes Rebate
Profile: Retired couple, outer Melbourne. 6.6 kW solar. 7 kWh daily export. 8 kWh overnight consumption. 10 kWh BYD HVM battery.
FiT: 5 cents/kWh
Grid rate: 30 cents/kWh (flat)
Calculation:
- Daily battery saving: 7 kWh × (30c − 5c FiT) = 7 × 25c = $1.75
- Annual saving: $639
Net battery cost: $9,500 (BYD HVM) − $4,107 (CHBP) − $2,250 (VIC Solar Homes) = $3,143
Payback: 4.9 years — excellent result enabled by stacking state and federal rebates.
Example 4: QLD Household With Pool
Profile: Family of 5, Brisbane. 8 kW solar. 15 kWh daily export. 14 kWh overnight consumption (including pool pump). Powerwall 3.
FiT: 8 cents/kWh
Grid rate: 30 cents/kWh flat
Calculation:
- Battery stores 13.5 kWh (mostly fills on a good day)
- Daily saving: 13.5 kWh × (30c − 8c FiT) × 90% efficiency = 12.15 kWh × 22c = $2.67
- Annual saving: $975
Net cost (CHBP applied): ~$9,500. Payback: 9.7 years. Tighter case — QLD's higher FiT reduces the spread. The QLD Battery Booster rebate (if available) would bring payback down to ~6.5 years.
What the Examples Show
Annual savings range from ~$640 to ~$1,250 depending primarily on:
- State: SA's high rates and low FiTs create the strongest case
- Tariff type: TOU peak rate households have stronger cases than flat rate
- Rebates: Stacking CHBP + state rebate is the biggest factor in payback period
The realistic annual saving range for most Australian households with a 10–13.5 kWh battery and 6.6+ kW solar: $700–$1,500/year. Higher at the extreme end for SA households on TOU plans with all rebates stacked.
Comments (0)
No comments yet. Be the first to share your thoughts!