How Much Can You Save with a Home Battery? Real Australian Examples
Marketing materials for home batteries love round numbers. "Save up to $2,400 per year!" "Slash your electricity bill in half!" Real-world outcomes are messier — and in many cases, still genuinely good. Let me walk you through what Australian households with batteries are actually experiencing.
These case studies are based on composite data from households across different states, system sizes, and usage profiles. All figures are approximate and based on actual metering data patterns — not vendor projections.
Case Study 1: Melbourne Family of Four, 6.6kW Solar + 10kWh Battery

Setup: 6.6kW solar panel system (existing, 4 years old), BYD Battery-Box 10.2kWh added in October 2025 after CHBP launched.
Electricity usage: 22–28 kWh/day
Tariff: Time-of-use, Amber Electric
Pre-battery annual bill: $2,800
What changed after battery:
- Self-consumption rate increased from 41% to 78%
- Peak grid imports dropped by 85%
- Annual bill reduced by approximately $1,450
- Net battery cost after CHBP + VIC Solar Homes rebate: ~$5,100
- Implied payback: 3.5 years
Key factor: being on Amber Electric's pass-through tariff with careful battery scheduling during high wholesale price periods added approximately $300/year in extra savings versus a flat retail tariff.
Case Study 2: Sydney Two-Person Household, 5kW Solar + 6.5kWh Battery
Setup: 5kW solar, Sungrow SBR 6.4kWh battery installed alongside solar in mid-2025.
Electricity usage: 11–15 kWh/day
Tariff: Flat-rate, Origin Energy
Pre-battery annual bill: $1,600 (solar already reducing bills)
What changed after battery:
- Self-consumption rate: 89%
- Annual bill reduced to approximately $480
- Annual saving: $1,120
- Net battery cost after CHBP: ~$5,800
- Implied payback: 5.2 years
Key factor: the household's relatively low usage meant a smaller battery (6.4kWh) was right-sized — they didn't pay for capacity they couldn't use. A 10kWh battery here would have had worse economics.
Case Study 3: Brisbane Family, 10kW Solar + 13.5kWh Tesla Powerwall 3
Setup: New 10kW solar + Powerwall 3 combined install, April 2025. Property also has pool pump and ducted AC.
Electricity usage: 35–50 kWh/day (high summer), 20–30 kWh/day (winter)
Tariff: TOU, AGL
Pre-solar/battery bill: $4,800/year
Post-install outcome:
- Annual electricity costs: approximately $600 (still importing some grid power on low-sun days and AC peaks)
- Annual saving: $4,200
- Net system cost (solar + battery, post CHBP + QLD Battery Booster): ~$19,000
- Implied payback: 4.5 years
Key factor: large solar doing the heavy lifting (10kW generates substantial surplus in Brisbane sunshine), with the battery capturing overflow for evening use. High original bill meant more room to save.
Case Study 4: Regional NSW Household, Off-Peak Grid + 10kWh Battery (No Solar)
Setup: Battery-only install (no solar), grid arbitrage on a high shoulder/peak TOU tariff. Battery charges overnight on off-peak rates.
Electricity usage: 18–22 kWh/day
Tariff: TOU with off-peak at 12c/kWh and peak at 48c/kWh
Annual saving from arbitrage:
- 10 kWh × (48c − 12c) × 365 = $1,314/year (theoretical max)
- Real-world outcome (accounting for charging efficiency and imperfect scheduling): approximately $900–$1,100/year
- Net battery cost after CHBP: ~$8,500
- Implied payback: 8–9 years
Key factor: battery-only without solar is viable on extreme TOU tariffs but the payback is borderline. This household also valued blackout backup during frequent rural outages — factoring that in, the decision made sense for their situation.
Case Study 5: Adelaide Couple, 6.6kW Solar + 10kWh Battery + VPP
Setup: Existing 6.6kW solar, added Alpha ESS 10.24kWh battery in August 2025. Enrolled in SA Power Networks' VPP program.
Electricity usage: 12–16 kWh/day
Tariff: TOU + VPP earnings
Outcomes:
- Bill savings from self-consumption: approximately $1,050/year
- VPP program earnings: approximately $350/year (dispatched ~15 times)
- Total annual benefit: $1,400/year
- Net battery cost after CHBP: ~$6,000
- Implied payback: 4.3 years
Key factor: SA's high electricity prices and active VPP programs make Adelaide one of the better markets for battery economics. The VPP earnings are a genuine bonus, not a core case — but they help.
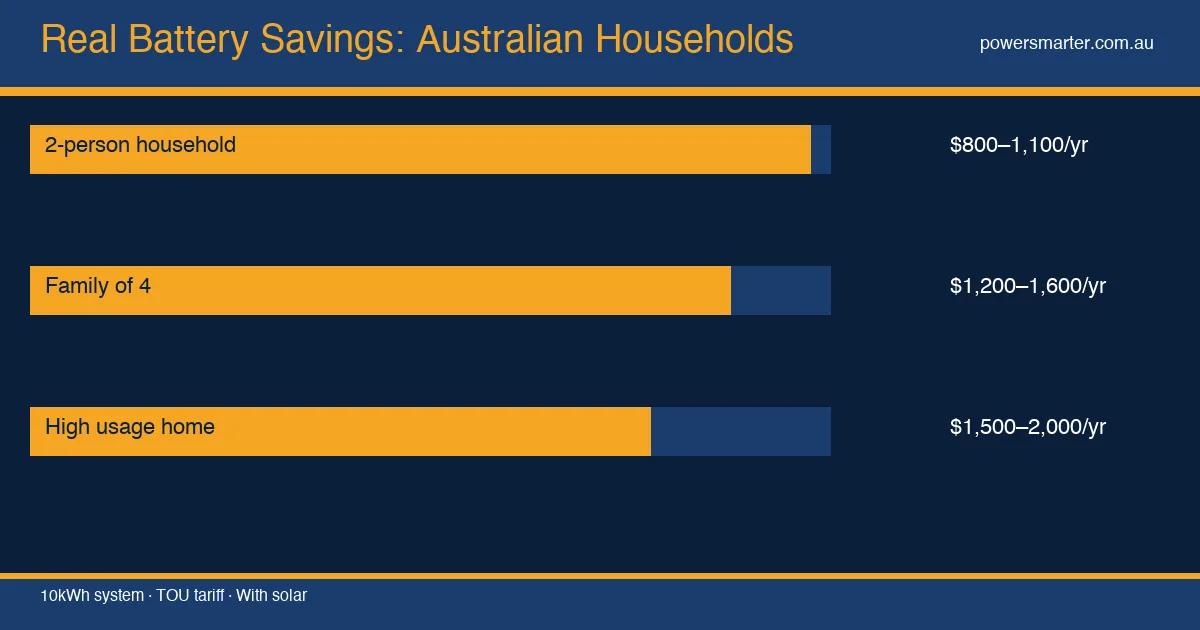
What the Data Says Overall
Across these scenarios, a clear pattern emerges:
- Best outcomes: Households with large solar systems (6.6kW+), high electricity usage (18+ kWh/day), TOU tariffs with high peak rates, and access to stacked rebates. Paybacks of 3–5 years are realistic.
- Average outcomes: Typical household (4 people, 20 kWh/day), 6.6kW solar, CHBP only. Bill savings of $1,000–$1,400/year. Payback 6–8 years. Reasonable over a 10-15 year system life.
- Weaker outcomes: Small solar (3kW or less), flat tariff with decent FiT, no state rebate. Savings might be $600–$900/year. Payback 9–12 years. Borderline financial case.
How to Get a Realistic Estimate for Your Home
The cases above make clear that "how much will I save?" is heavily dependent on your specific situation. Before committing, ask for a quote that includes:
- A savings estimate based on your actual consumption data (not generic assumptions)
- Modelled self-consumption rate post-battery
- Payback period calculated at current electricity prices
- Which rebates are included and how they're applied
Any installer who gives you a savings estimate without asking to see your electricity bill data is doing guesswork. Good installers ask for 12 months of usage data before quoting.
Comments (0)
No comments yet. Be the first to share your thoughts!