How Much Can You Really Save with a Home Battery in Australia?

Battery vendors love citing impressive annual savings figures. The problem is that savings vary enormously depending on factors specific to each household — and the headline numbers are almost always the best-case scenario, not the typical one.
Here's a realistic breakdown of what homeowners are actually saving, and which factors drive the outcome.
The Key Variables That Determine Your Savings
1. Your Current Electricity Tariff
This is the single biggest driver. Every kWh your battery dispatches instead of pulling from the grid saves you the grid import rate — currently 28–42 cents/kWh across Australia. Households on time-of-use plans with high evening peak rates (40–55c/kWh) get more value per kWh stored than households on flat tariffs at 29c/kWh.
2. How Much Solar You Have (and Export)
A battery can only save what it stores, and it can only store what your solar generates as surplus. If you have a small solar system (3kW) and high daytime energy use (working from home), your battery may never fully charge — limiting its savings potential. A 6.6kW+ system with significant excess export is the sweet spot for battery value.
3. Your Household's Evening Energy Use Pattern
Batteries make money by covering evening and morning loads when solar isn't generating. If you use most electricity overnight, a bigger battery covers more of that load. If you're a light energy user (8–12 kWh/day total), a 10kWh battery is more than you need — and you won't use all of it.
4. Battery Size vs Your Needs
Bigger isn't always better. An oversized battery that regularly finishes the night half-full is wasting capacity — you're paying for storage you never use. A right-sized battery cycling deeply every day delivers better economics than an oversized one cycling shallowly.
5. Which Rebates You've Accessed
Savings rate (annual dollar benefit) stays similar regardless of rebates. But rebates dramatically affect the net investment — and therefore payback period. A household saving $1,200/year from a battery that cost $5,000 net has a 4-year payback. Same savings from a $10,000 net cost battery: 8-year payback. Same savings, very different financial outcome.
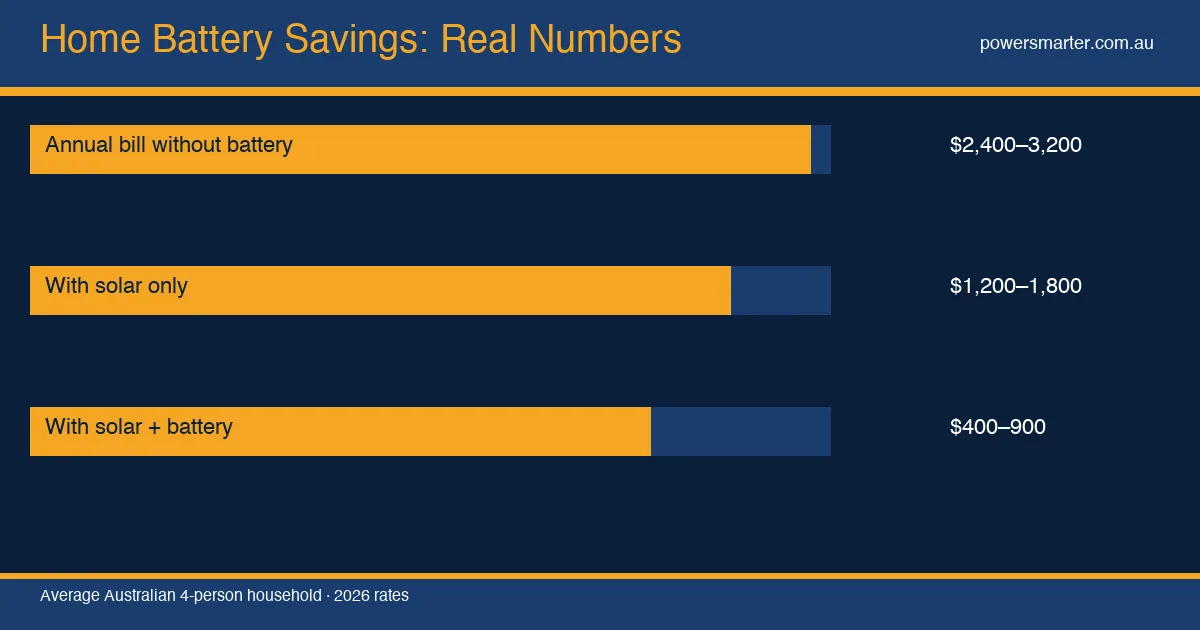
Realistic Annual Savings Ranges
Scenario A: Small System (5kW Solar + 6.5kWh Battery), Flat Tariff
- Typical household: 2 people, 10–14 kWh/day usage
- Annual electricity savings: $600–$900
- Notes: Good self-sufficiency, but limited by small solar and battery
Scenario B: Standard System (6.6kW Solar + 10kWh Battery), Flat Tariff
- Typical household: 4 people, 18–25 kWh/day usage
- Annual electricity savings: $1,000–$1,400
- Notes: Most common Australian household scenario
Scenario C: Standard System (6.6kW Solar + 10kWh Battery), TOU Tariff with High Peak Rate
- Same household as B, but on evening peak of 45c/kWh, off-peak of 18c
- Annual electricity savings: $1,400–$1,900
- Notes: TOU tariff significantly improves battery economics
Scenario D: Large System (10kW Solar + 13.5kWh Battery), TOU Tariff, + VPP
- Larger household: 4–5 people, 25–35 kWh/day usage
- Annual electricity savings: $2,000–$3,000 (including VPP income)
- Notes: Higher solar system + TOU + VPP delivers the best combined outcome
Scenario E: High-Usage Household with EV (10kW Solar + 20kWh Battery)
- EV added, replacing petrol/gas costs
- Annual electricity savings + avoided petrol cost: $3,500–$5,000
- Notes: EV integration dramatically improves overall home energy economics
What the Data Shows
The consistent picture from real installations:
- Most households with a 6.6kW solar + 10kWh battery on a reasonable tariff save $1,000–$1,500/year. This is the realistic middle.
- Households with TOU tariffs and/or VPP can push to $1,500–$2,000.
- Households with large solar systems (10kW+), EVs, or high electricity usage can save $2,500–$5,000 when all elements are aligned.
- Small systems or flat tariffs with decent FiT rates at the low end: $600–$900/year.
The Marketing vs Reality Gap
When a battery company says "save up to $2,400/year," they're describing a real but specific scenario — large solar, TOU tariff, high electricity usage, optimal system configuration. That's not representative of the average install.
When a battery sceptic says "batteries don't pay off," they're often citing pre-CHBP prices with no rebates — also not representative of what's available in 2026.
Reality sits between these extremes: most households with a properly sized, properly configured battery + solar system save $1,000–$1,500/year and achieve payback within 6–8 years — inside the 10-year warranty period. With state rebates stacked, payback compresses to 3–5 years.
How to Estimate Your Specific Savings
The best way to get a realistic estimate:
- Find an installer who asks for 12 months of electricity usage data before quoting
- Ask them to model your self-consumption rate post-battery (should be 70%+ if properly sized)
- Ask for savings modelled at your actual tariff — not generic assumptions
- Ask what happens to the savings if electricity prices increase 5% per year (the historical average)
Any installer who gives you a savings estimate without seeing your usage data is guessing. Good installers model your specific situation. That's what should drive your decision — not a headline number from a brochure.
Comments (0)
No comments yet. Be the first to share your thoughts!