Home Energy Monitoring 101: What to Measure (Before You Buy Anything)
One of the most common energy upgrade mistakes is buying equipment based on assumptions rather than data. How much energy does your household actually use? When do you use it? Which appliances are the biggest consumers? The answers should drive your upgrade decisions — not guesswork or salespeople's assumptions.
Here's how to gather the data that makes every subsequent energy decision better.
What to Measure Before Buying Solar, Battery, Heat Pump, or EV
Total Daily Consumption
The single most important number: how many kWh does your household consume per day, on average, and what are the seasonal extremes?
How to get it:
- From your electricity bill: Find your annual kWh and divide by 365. Most bills show this or you can calculate from the kWh usage and usage period.
- From your retailer's online portal: Most Australian retailers (AGL, Origin, Energex, etc.) show 12 months of interval meter data if you have a smart meter. This gives daily and hourly granularity.
- From your smart meter: If you have a smart meter (interval meter), your DNSP can provide interval data on request. The government's Energy Made Easy portal also allows retrieval of this data.
Daytime vs Evening Consumption Split
For battery sizing, you need to know how much power your household uses when solar isn't generating — roughly 5pm through 8am the following day. This is the overnight consumption your battery needs to cover.
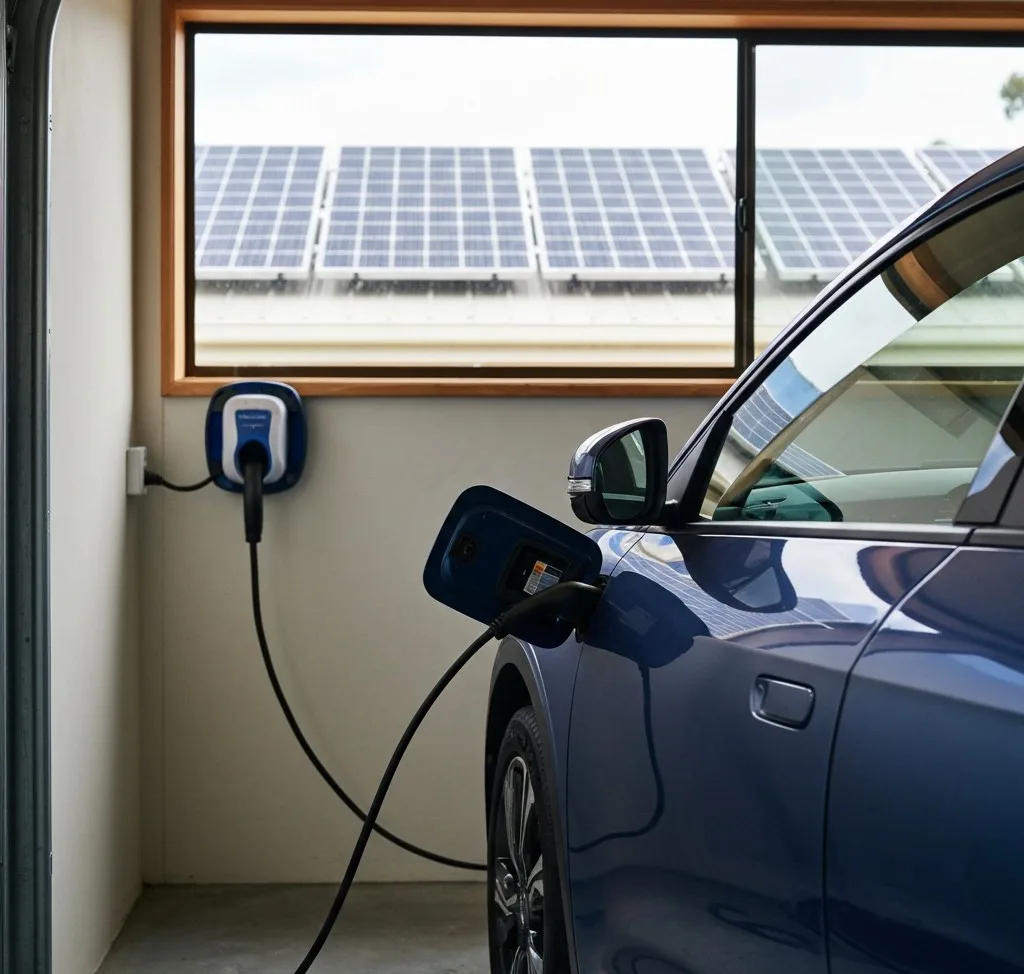
If your retailer shows hourly interval data, add up the consumption from 5pm to 8am. For a typical Australian household, this is 8–15 kWh. For an EV household, it can be 20+ kWh.
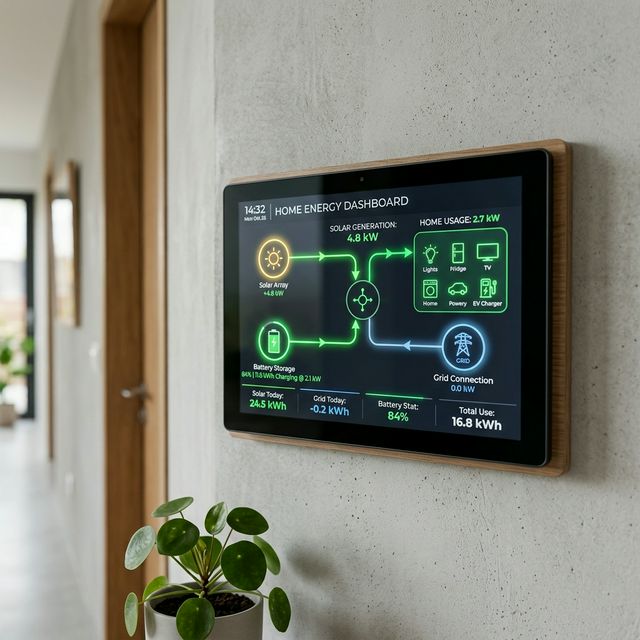
Solar Generation vs Export (If You Already Have Solar)
If you have solar, your inverter app (or retailer portal) should show:
- Total daily solar generation
- Self-consumed portion (used directly in the house)
- Export to grid
The export figure is your battery's primary opportunity — it's solar that's currently worth 5–8 cents that a battery could store for 30–35 cent evening value.
Tools for Monitoring
Smart Meter Data (Free, Best Starting Point)
Australia's rollout of smart interval meters (also called smart meters or digital meters) means most households now have access to 30-minute interval consumption data. This is free and the most accurate starting point.
Access options:
- Retailer online portal (AGL, Origin, Energy Australia, etc. all provide this)
- Energy Made Easy (government portal)
- State-specific portals in VIC, QLD, etc.
Plug-In Energy Monitors (Appliance Level)
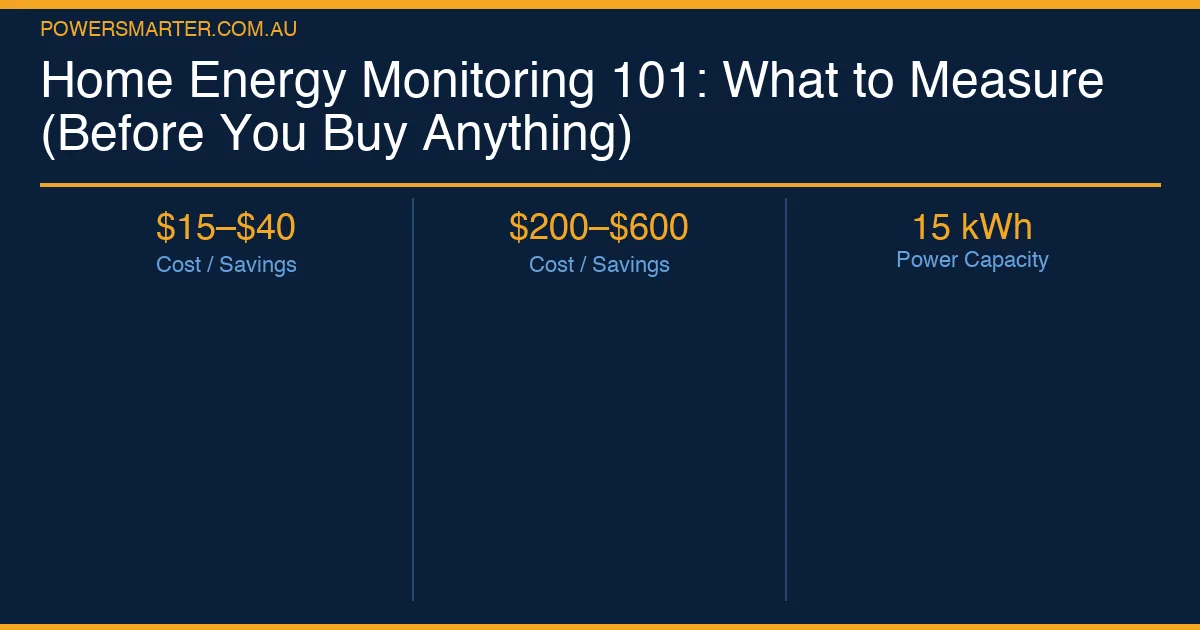
For understanding which appliances are using the most power, a plug-in energy monitor ($15–$40 from hardware stores) lets you measure individual appliances directly. Particularly useful for: ageing fridges, older air conditioners, pool pumps, electric hot water systems.
An old fridge can use 800–1,500 kWh/year. Knowing this might justify replacement before investing in solar or battery.
Whole-Home Energy Monitor
Products like Sense, Emporia, or locally available CT-clamp monitors install at the switchboard and provide real-time, appliance-level data for your entire home. Cost: $200–$600. These are valuable but are a bigger investment — start with smart meter data first.
What to Do With the Data
Before Getting Solar
Knowing your daily consumption and daytime vs evening split helps you size the solar system correctly. A household using 25 kWh/day needs a larger system than one using 12 kWh/day, even if both have similar roof space.
Before Getting a Battery
Your overnight consumption tells you the minimum battery size worth considering. If you use 8 kWh overnight, a 5 kWh battery will cover only part of it — consider 10 kWh minimum. If you use 15 kWh overnight, 10 kWh is right for most budgets, with 13.5 kWh (Powerwall 3) the better fit if budget allows.
Before Getting a Heat Pump
Knowing your hot water energy use (if electric resistance, it's often 15–25% of total consumption) helps quantify the savings from switching. A heat pump uses roughly 1/3 the electricity for the same hot water output.
The 30-Minute Investment That Changes Everything
Log into your retailer's portal, download 12 months of interval data, and spend 30 minutes with a spreadsheet. Add up daily averages, identify seasonal peaks, and understand your overnight consumption. This data will make every subsequent conversation with an installer more productive — and every decision you make more precise.
Comments (0)
No comments yet. Be the first to share your thoughts!